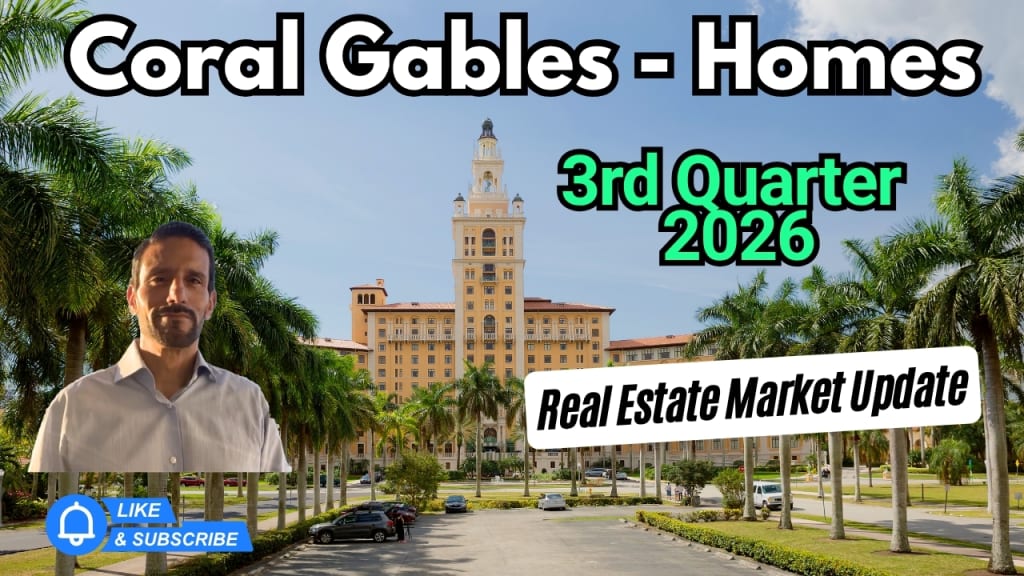

Coral Gables, Miami — The 3rd Quarter data is in and demand and prices seem to be holding in the Gables, and the data tells the full story.
Demand for homes in Coral Gables continues to be strong quarter over quarter. Months of Supply remains low as does Days on Market and Closings remain consistent... exactly what you want to see in a market.
In this video I break down exactly what happened in the Coral Gables homes market in the 3rd Quarter of 2026:
Month by month, Year to Date (1st Quarter vs 2nd Quarter vs 3rd Quarter), and what it all means for buyers and sellers right now.
And here are the numbers...
📊 Total Closings:
3rd Quarter 2026 = 86
📊 Closed Sales:
Non-Waterfront Homes = 79
Waterfront Homes = 7
📊 Price Per Square Foot:
Non-Waterfront = $919
Waterfront = $1,765
📊 Median Sold Price:
Non-Waterfront = $2,395,000
Waterfront = $8,920,000
📊 Months of Supply:
Non-Waterfront = 4
Waterfront = 8
🏆 Top Sale of the Quarter:
$24.5 Million — Gables Estates, the premier gated waterfront community in Coral Gables. An 8-bedroom waterfront home of over 11,000 square feet, built in 2000, at $2,068 per square foot. Seems to be like a land purchase.
📍 I was born and raised in Miami, and I cover Coral Gables and only a few other Miami neighborhoods I specialize in with real data, real numbers, and 20 years of experience behind every stat I share.
❓ Questions about buying or selling in Coral Gables? Reach out directly. I am always happy to help.
#CoralGables #MiamiHomes #CoralGablesRealEstate #CoralGablesHomes #MiamiRealtor #MiamiRealEstateMarket #GablesEstates #3rdQuarter2026 #MiamiRealEstate #MiamiLuxuryHomes