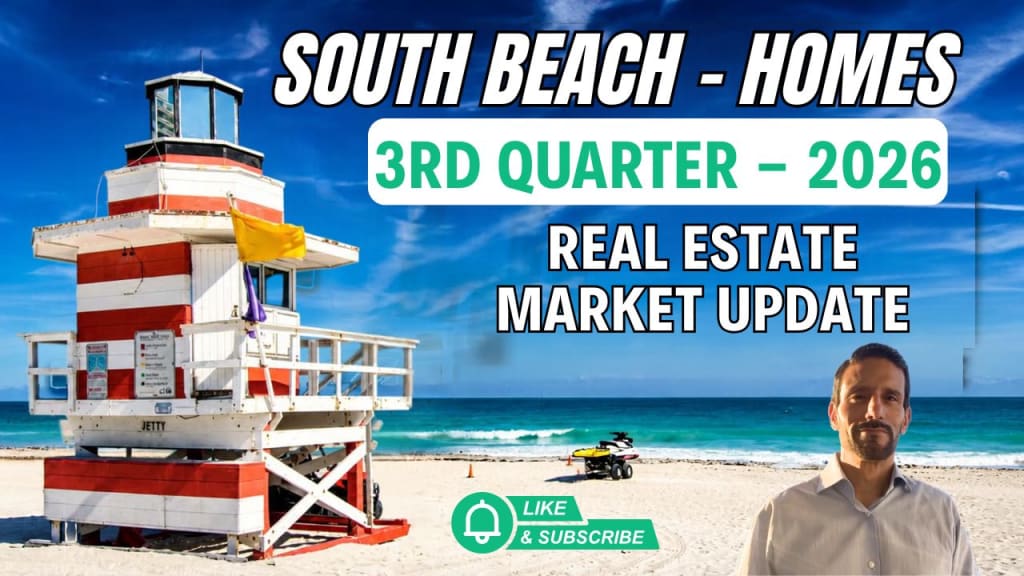

South Beach, Miami Beach — Waterfront median price jumped 42% to $22 Million in the 3rd Quarter of 2026 while non-waterfront homes pricing held on.
South Beach is not one market — it is two markets. Waterfront and non-waterfront tell two very different stories, and the 3rd Quarter data makes that divide clearer than ever.
In this video I break down exactly what happened in the South Beach homes market in the 3rd Quarter of 2026:
Month by month, Year to Date (1st Quarter vs 2nd Quarter vs 3rd Quarter), and what it all means for buyers and sellers right now.
And here are the numbers...
📊 Total Closings:
3rd Quarter 2026 = 22
📊 Closed Sales:
Non-Waterfront Homes = 11
Waterfront Homes = 11
📊 Price Per Square Foot:
Non-Waterfront = $1,181
Waterfront = $3,919
📊 Median Sold Price:
Non-Waterfront = $2,800,000
Waterfront = $22,000,000
📊 Months of Supply:
Non-Waterfront = 6
Waterfront = 7
🏆 Top Sale of the Quarter:
$40 Million — a Palm Island waterfront land assembly, over 1.5 acres (60,000 square feet) of direct waterfront land. Even though there was a home on this property, word on the street is was purchased as a land assembly.
📍 I cover South Beach and a few other Miami neighborhoods I specialize in with real data, real numbers, and 20 years of experience behind every stat I share.
❓ Questions about buying or selling in South Beach? Reach out directly. I am always happy to help.
#SouthBeach #MiamiHomes #MiamiBeachRealEstate #SouthBeachHomes #MiamiRealtor #MiamiRealEstateMarket #MiamiWaterfrontHomes #3rdQuarter2026 #MiamiBeachHomes #MiamiBeachHomeMarket